Optimizing rates across major carriers


Your carriers aren't giving you their best rates, and they never will on their own. We analyze your invoices, find where you're overpaying, and show you exactly how to get better pricing.
Our average client saves 18% annually.
Optimizing rates across major carriers
THE REAL NUMBERS
| Charge | 2019 | 2026 | Increase |
|---|---|---|---|
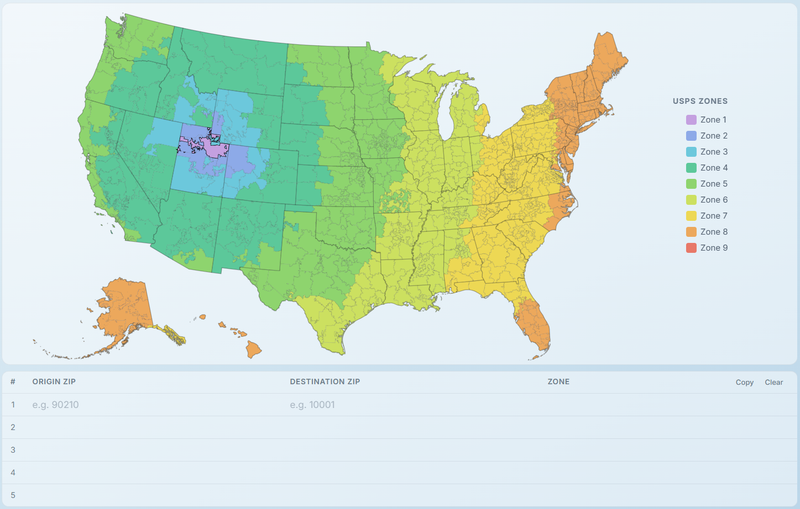
| Ground (1 lb, Zone 2) | $7.85 | $11.99 | +53% |
| Residential Surcharge | $3.80 | $6.45 | +70% |
| DAS-Extended | $2.85 | $5.55 | +95% |
| Fuel Surcharge | 6.95% | 25.50% | +267% |
A 1 lb residential ground package. Same box, same weight, same destination is 86% more expensive today. And that's before additional handling, peak surcharges, or any other accessorials.
Implemented in the early 2000s to help carriers cover rising fuel costs. 26 years later, they're 25.50% of your bill and rising. On a $50 shipment, that's $12.75 in fuel alone. On a surcharge that was never supposed to be permanent.
Additional handling used to be a flat fee. Now it's zone-tiered. Carriers quietly turned a surcharge into a second distance-based charge. A heavy package surcharge went from $20 flat to $46-$59 depending on zone.
Carriers aren't going to tell you where the savings are. If you're not auditing every line, you're overpaying.
WHY IT'S HARD
Carriers give you big discounts on services you barely use. The services and surcharges driving your actual spend? Those get the thinnest discounts. It's by design.
Without cost modeling tools that break down every service, zone, weight tier, and surcharge, you don't know what optimal pricing looks like. You're accepting whatever your rep offers because you have nothing to compare it to.
Annual rate increases, new surcharge categories, zone reclassifications, DIM weight changes. Carriers are constantly shifting the math. What worked last year doesn't work this year.
SAVINGS ESTIMATOR
Drag the slider to your monthly shipping spend.
Want the exact number?
Get Your Free AnalysisHOW IT WORKS
Any format, any carrier. Just forward what you have. We handle the rest.
Our software breaks down every charge across your entire shipping profile and calculates what you should actually be paying.
We tell you exactly what to ask for, what to push back on, and how to get your carriers to move. If a different carrier makes more sense, we can help with that too.
Get a free analysis of your shipping spend. We'll show you exactly where you're overpaying and how much you can save.